


The Quantitative Protocol
Where timeless economic wisdom meets modern financial science.

The Quantitative Investment Management Protocol
Safe Haven Capital’s investment philosophy is anchored in The Quantitative Investment Management Protocol — a rigorous quantitative framework that synthesises timeless economic wisdom with modern financial science.
This proprietary approach provides systematic guidance for crisis preparedness and counter-cyclical wealth generation.
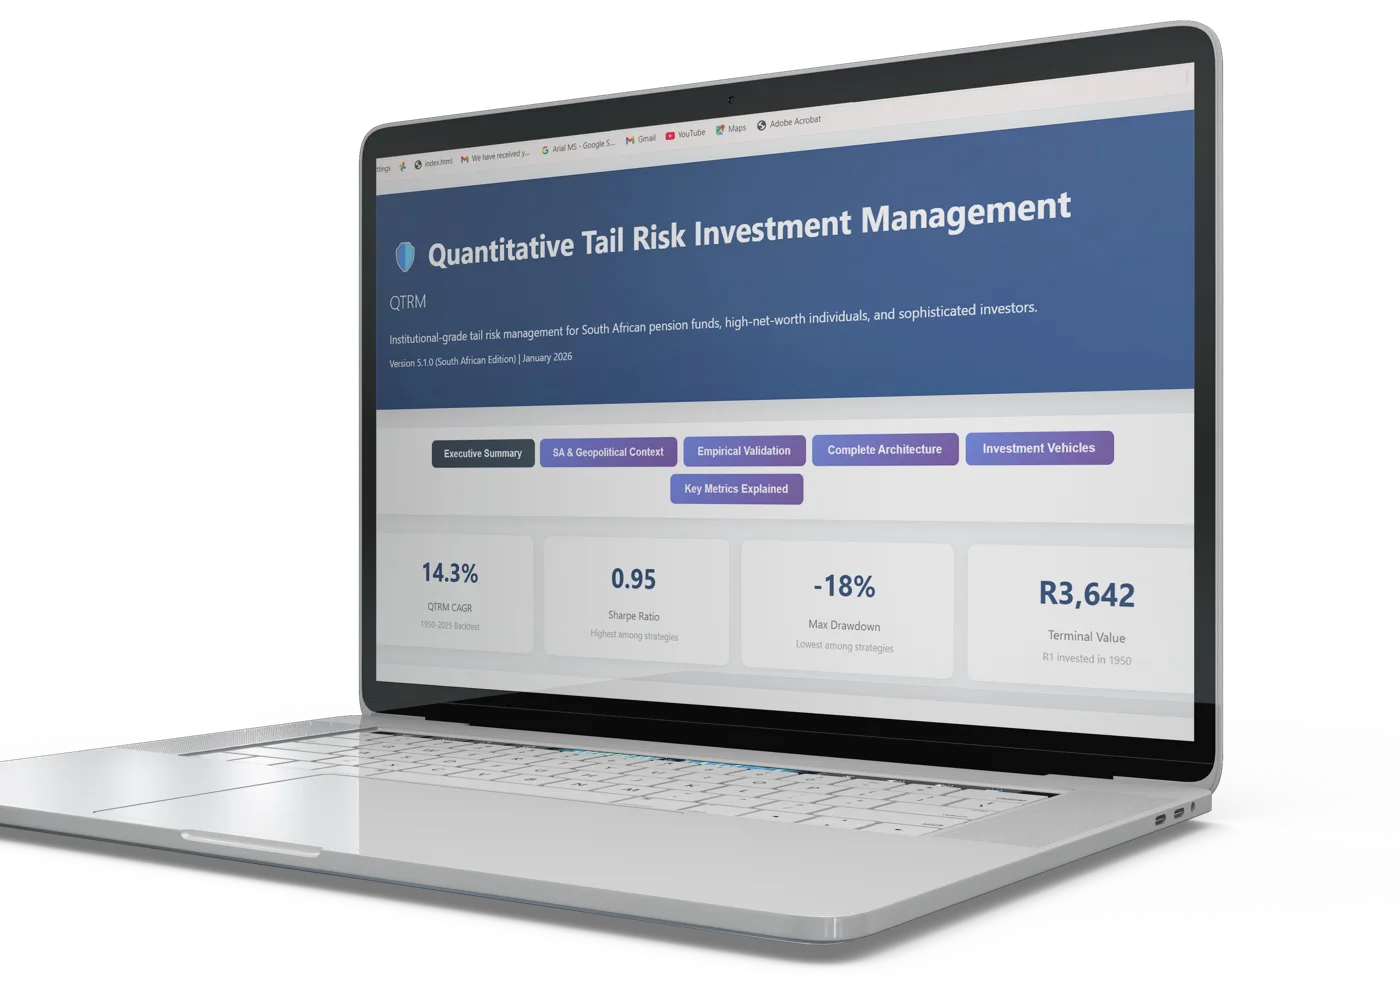
The Science Behind the Protocol
Mandelbrot’s Fractal Market Theory
Recognition that markets exhibit fat-tailed distributions, rendering traditional Gaussian models inadequate for extreme event prediction. We design portfolios that account for the true nature of market risk.
Taleb’s Antifragility Framework
Strategic positioning to gain from disorder and volatility through asymmetric payoff structures and convex exposure profiles. We don’t just survive market shocks — we benefit from them.
Spitznagel’s Tail-Risk Hedging
Cost-effective catastrophic protection enabling aggressive bull market participation while maintaining crisis alpha capability. Protection that pays for itself over market cycles.
Seven-Year Cycle Recognition
Systematic identification of secular market regimes ensuring liquidity deployment when distressed assets offer maximum value. Disciplined patience, decisive action.
Mandelbrot
Fat tails, power laws, market memory
Taleb
Antifragility, convex payoffs
Spitznagel
Tail hedging, volatility tax
Kelly
Optimal position sizing
See the Ideas in Action
Three hands-on explorations of the principles behind the protocol. Educational illustrations only — not forecasts or product performance.
How often does a crash happen?
Under a bell curve, extreme days are almost impossible. Real markets disagree. Move the sliders and compare.
Move size
5σTail heaviness (degrees of freedom)
4The fat-tailed model makes this move — more likely.
Two-sided probabilities of a daily move beyond the chosen size, using a unit-variance Student-t distribution versus a normal distribution, converted at 252 trading days a year. Educational illustration only.
The shape of convexity
A small allocation to out-of-the-money protection costs a little in calm markets — and can change the outcome dramatically in a crash.
Tail protection budget
3%Market move
-40%Cost in a +10% year: — — the “drag” the protection costs when markets rise.
Stylised payoff at expiry assuming a put option struck 20% below the market with a premium of 2% of notional. Not a forecast, product or performance illustration; real hedges are priced, structured and behave differently.
Growth broadens and confidence builds.
The core compounds; the tail layer is held as inexpensive insurance; the opportunistic reserve stays patient.
Valuations stretch and risk feels absent.
Discipline over excitement — protection is cheapest precisely when nobody wants it.
Volatility spikes and liquidity disappears.
Convex tail protection is designed to respond, generating liquidity when it is scarcest.
Distressed assets offer maximum value.
The opportunistic reserve and crisis proceeds are deployed counter-cyclically — decisive action after disciplined patience.
Select a point on the curve. Seven-Year Cycle Recognition seeks to identify secular market regimes so liquidity is deployed when distressed assets offer maximum value. Cycles are not regular or predictable in timing.
Three Layers, One Purpose
| Component | Allocation | Purpose |
|---|---|---|
| Core Equity & Fixed Income | 75–80% | Long-term wealth compounding |
| Tail Protection Layer | 2–5% | Crisis alpha generation & catastrophic loss prevention |
| Opportunistic Reserve | 15–20% | Counter-cyclical deployment in scarcity phases |
Disclaimer: No quantitative model can guarantee a specific outcome or eliminate risk entirely. The value of investments may go down as well as up, and past performance is not a guide to future results.
The Research Behind Every Mandate
Quantitative Tail Risk Investment Management
The protocol in one view: the problem, the QTRM solution and the outcome — grounded in the work of Mandelbrot, Taleb, Spitznagel and Kelly.
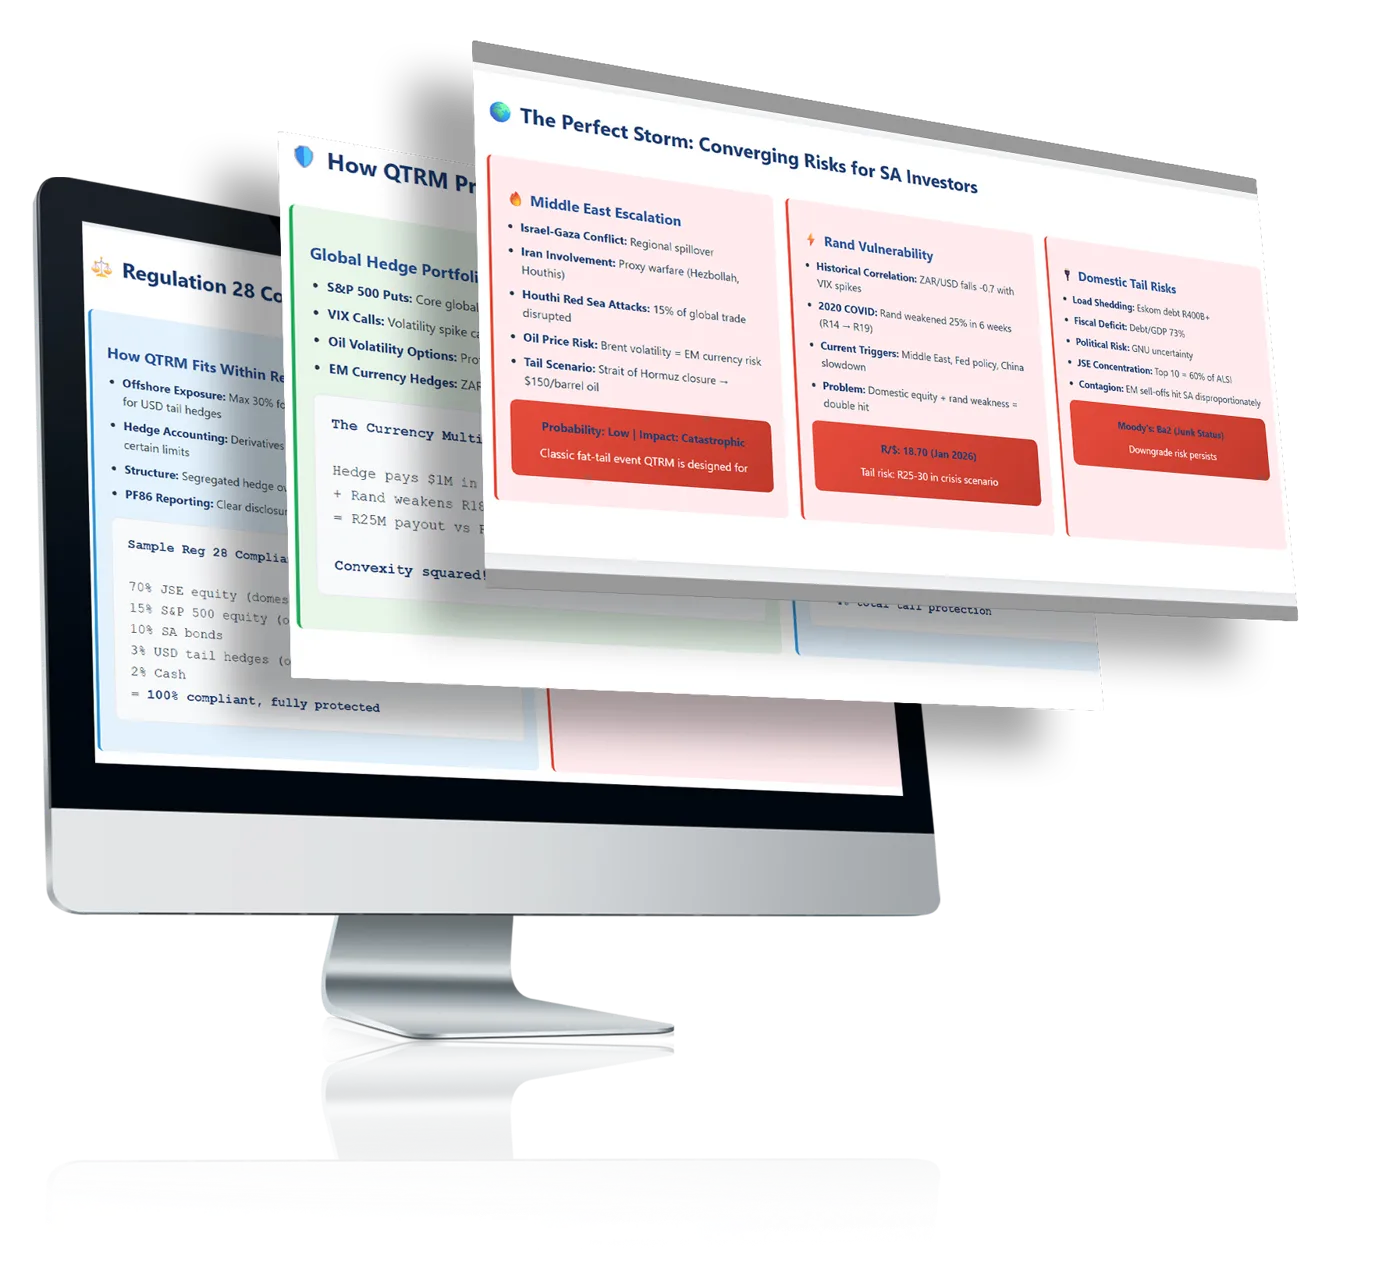
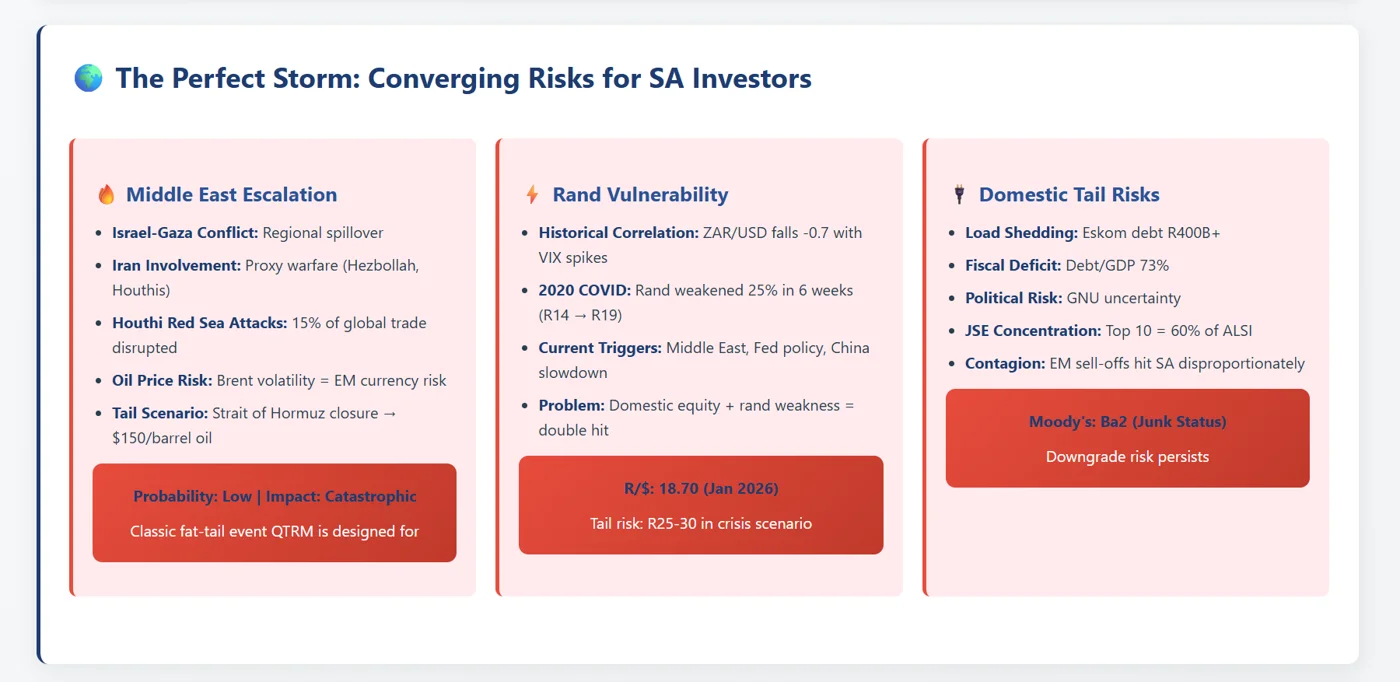
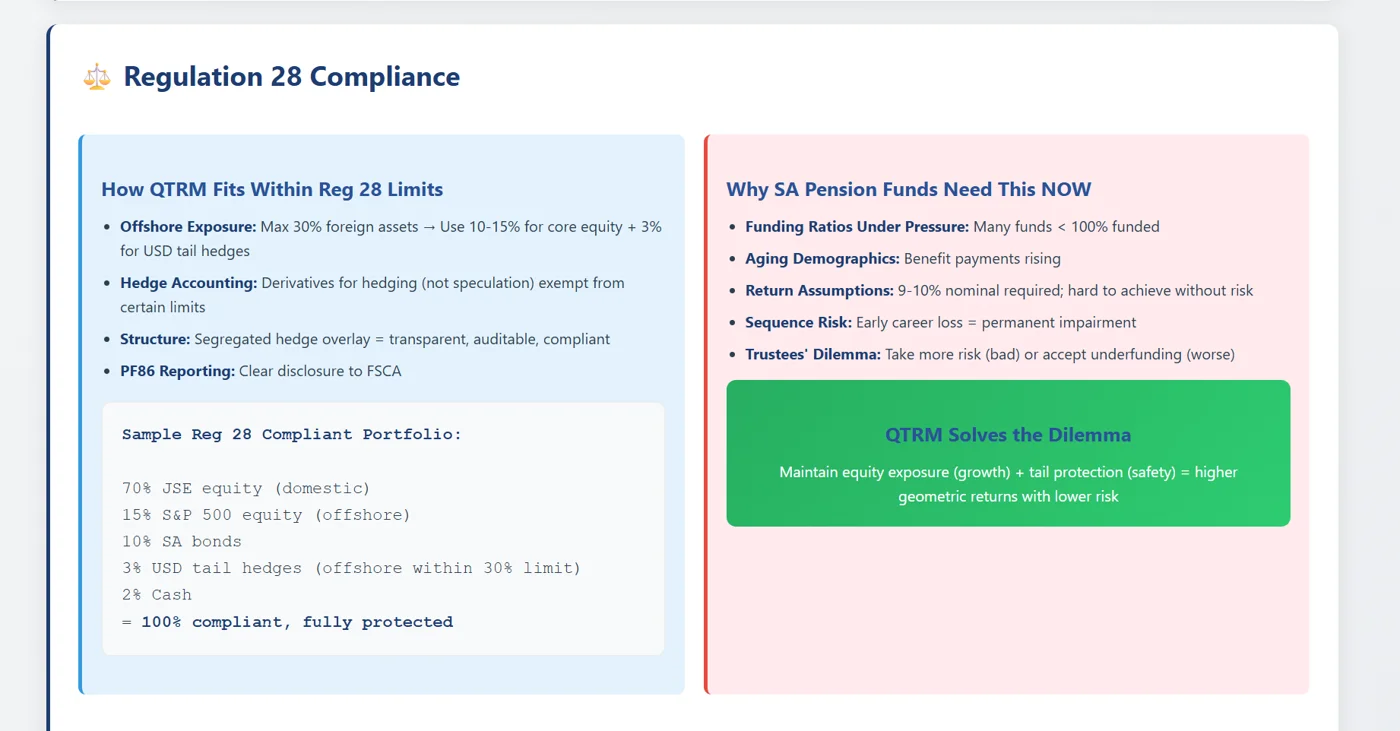
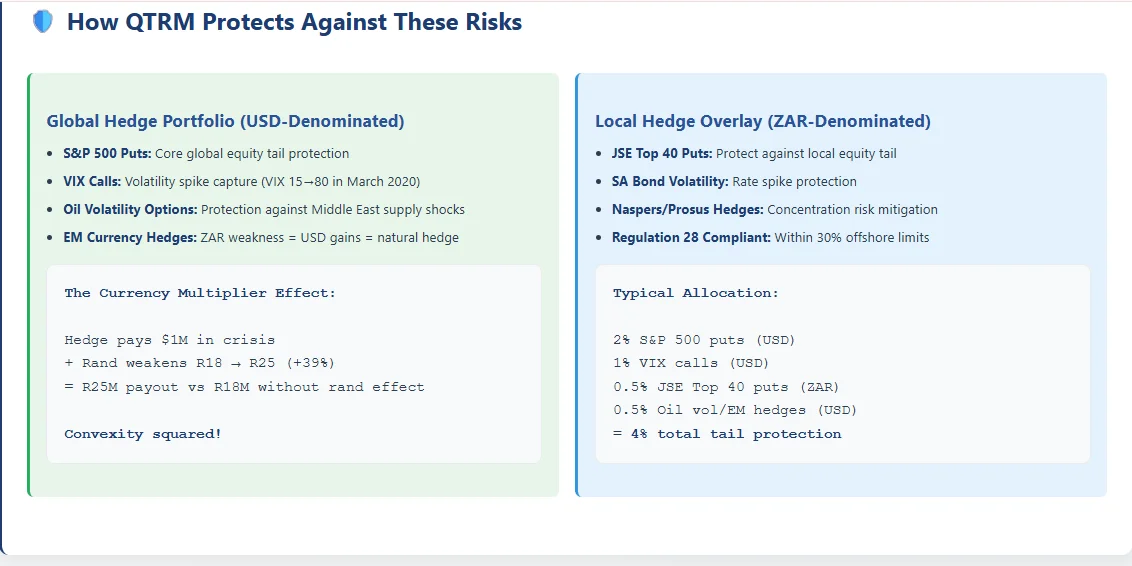
The perfect storm for South African investors
Converging risks facing SA investors, Regulation 28 compliance, and how the protocol is positioned to protect portfolios against them.
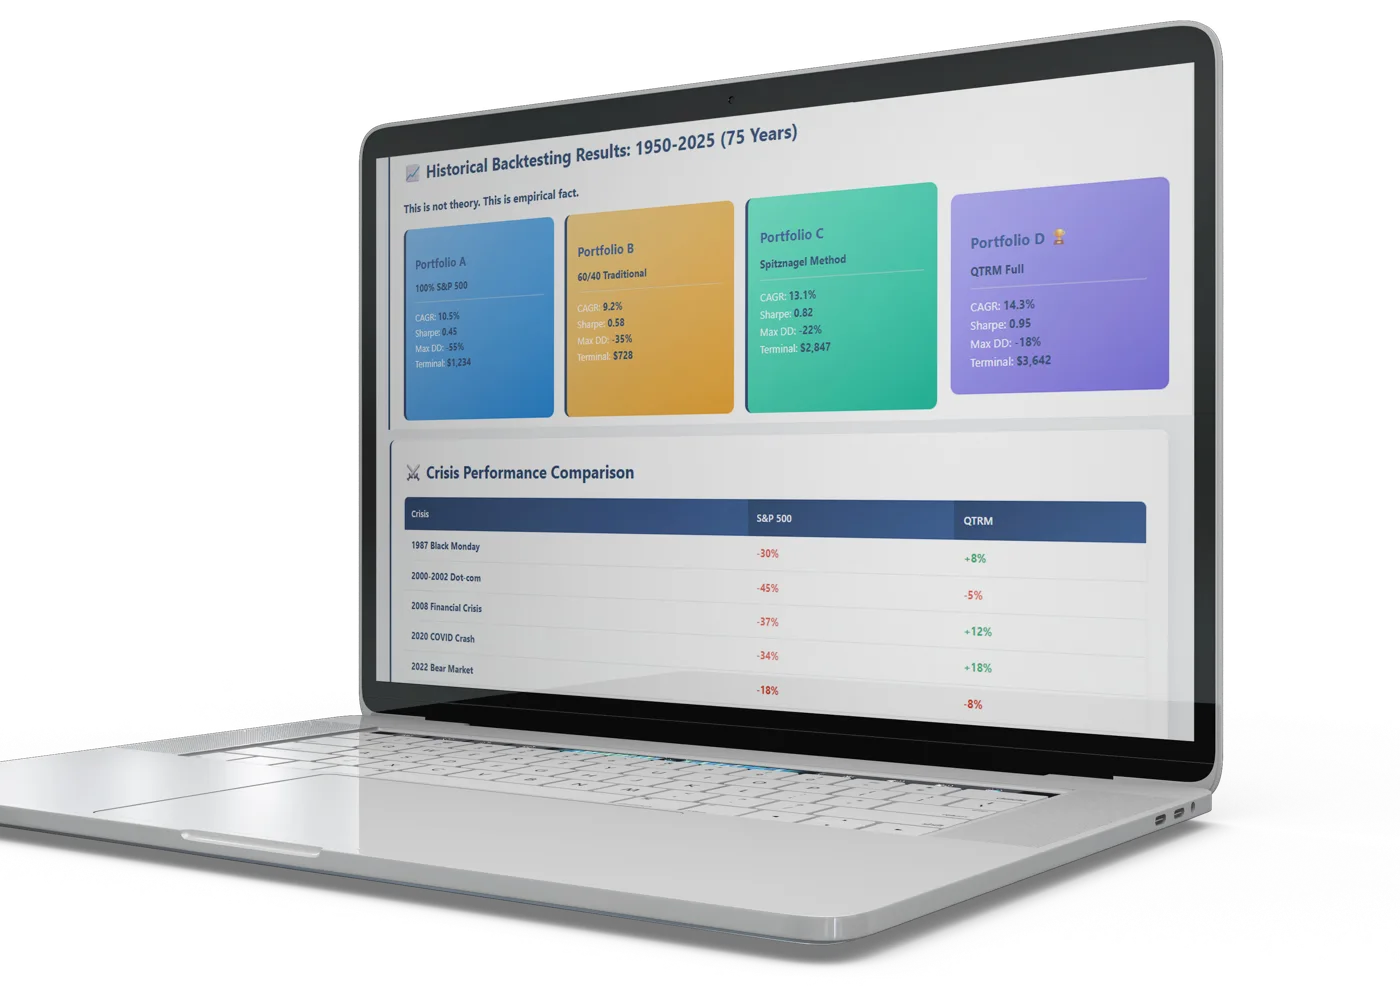
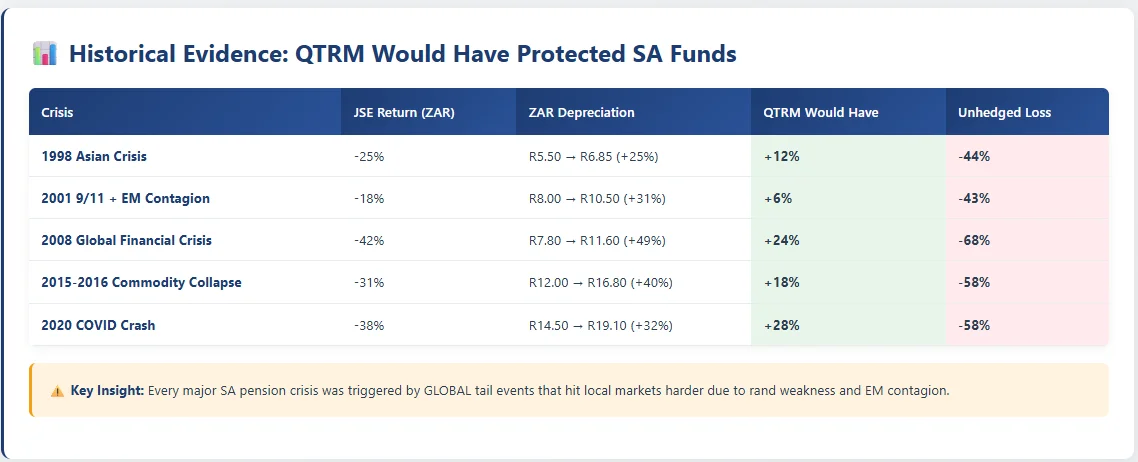
Tested against history
Historical backtesting across major market crises and a comparison of key portfolio metrics against conventional approaches.

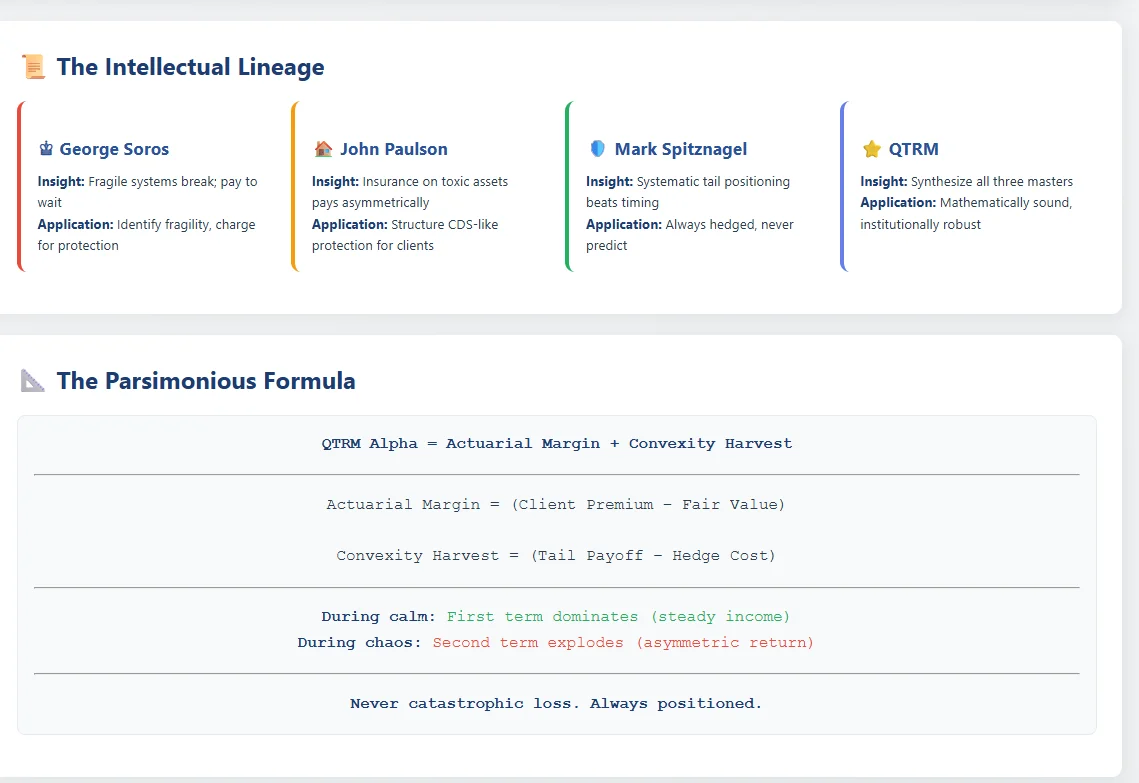
The parsimonious formula
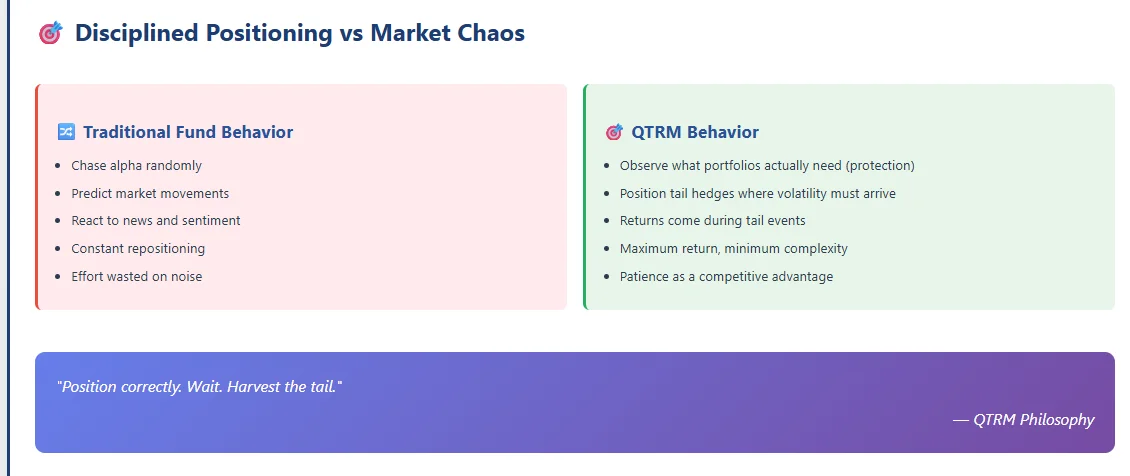
The intellectual lineage of the protocol, its parsimonious formula, and disciplined positioning versus market chaos.

From framework to implementation
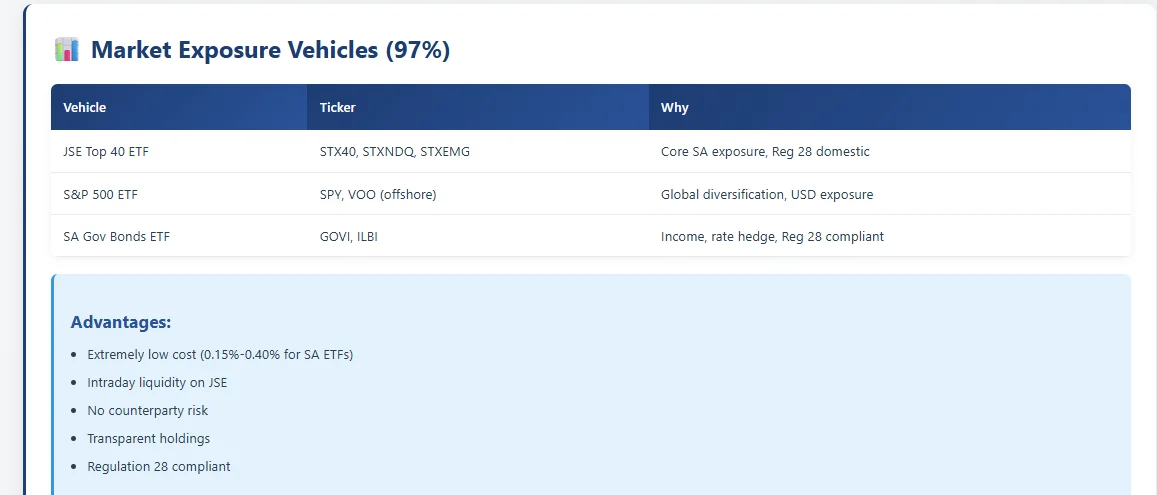
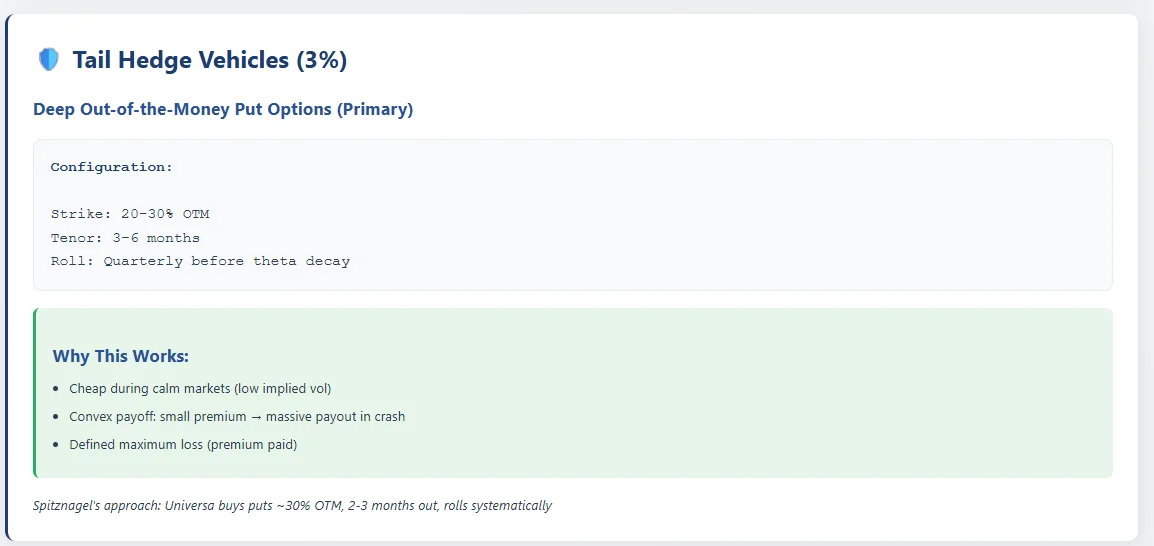
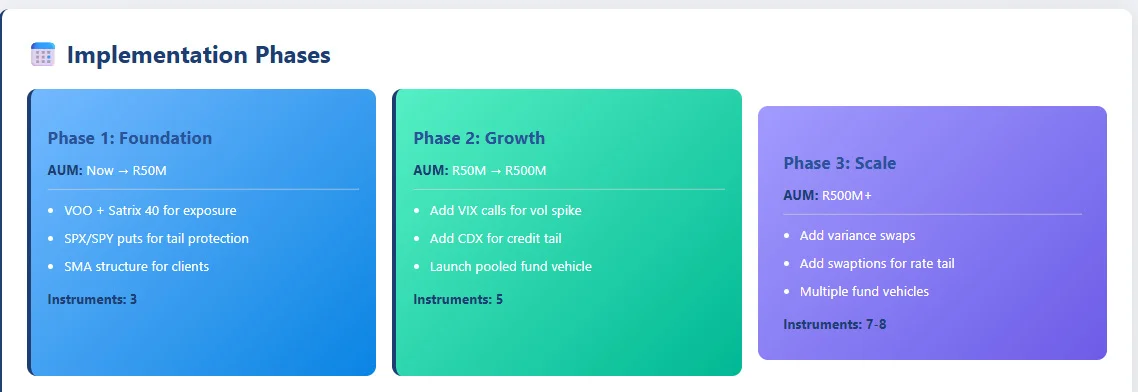
Market exposure vehicles, tail-hedge vehicles, counterparty and custody arrangements, and phased implementation.
A Closer Look
Select any panel to enlarge it.
Ready to put the protocol to work?
Discuss how the Quantitative Investment Management Protocol could apply to your portfolio or fund.